British parliamentary constituency
| Warwick and Leamington |
|---|
Borough constituency
for the House of Commons |
 Boundary of Warwick and Leamington in Warwickshire |
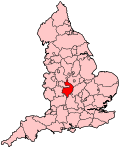 Location of Warwickshire within England |
| County | Warwickshire |
|---|
| Electorate | 66,278 (December 2010)[1] |
|---|
| Major settlements | Warwick and Leamington |
|---|
| Current constituency |
|---|
| Created | 1885 |
|---|
| Member of Parliament | Matt Western (Labour) |
|---|
| Seats | One |
|---|
| Created from | Warwick |
|---|
Warwick and Leamington is a constituency[n 1] represented in the House of Commons of the UK Parliament since the 2017 general election by Matt Western, of the Labour Party.
Members of Parliament
Constituency profile
The seat comprises the two eponymous towns, with modest hills surrounding them, in the upper valley of the River Avon.
The towns of Warwick and Royal Leamington Spa are still distinct, however, and form, in the modern seat, a contiguous urban area. Both towns are relatively affluent, although there are pockets of deprivation in Leamington. Warwick, with its historic castle, is an internationally advertised tourist destination, while Leamington's economy is more dependent on storage, distribution, manufacturing, processing, engineering and industry. Leamington is also more ethnically diverse (e.g. five per cent of the constituency's population is of Asian ethnicity)[clarification needed] and is home to some students of the University of Warwick that lies close to Coventry.
Unemployment claimants who were registered jobseekers were in November 2012 significantly lower than the national average of 3.8%, at 2.2% of the population based on a statistical compilation by The Guardian.[3]
Boundaries

Map of current boundaries since the 2010 general election
2010–present: The District of Warwick wards of Bishop's Tachbrook, Brunswick, Budbrooke, Clarendon, Crown, Manor, Milverton, Warwick North, Warwick South, Warwick West, Whitnash, and Willes. The 2010 boundary changes reduced the constituency's area by removing outlying villages, reflecting population and housing growth.
1997–2010: The District of Warwick wards of Bishop's Tachbrook, Brunswick, Budbrooke, Clarendon, Crown, Cubbington, Lapworth, Leek Wootton, Manor, Milverton, Radford Semele, Warwick North, Warwick South, Warwick West, Whitnash, and Willes, and the District of Stratford-on-Avon wards of Henley, Tanworth, and Tanworth Earlswood.
1983–1997: The District of Warwick wards of Bishop's Tachbrook, Brunswick, Budbrooke, Clarendon, Crown, Cubbington, Lapworth, Leek Wootton, Manor, Milverton, Radford Semele, Warwick North, Warwick South, Warwick West, Whitnash, and Willes.
1974–1983: As 1950 but with redrawn boundaries.
1950–1974: The Boroughs of Warwick and Royal Leamington Spa, the Urban District of Kenilworth, and the Rural District of Warwick.
1918–1950: The Boroughs of Warwick, Royal Leamington Spa, and Stratford-on-Avon, the Urban District of Kenilworth, the Rural Districts of Warwick and Alcester, and parts of the Rural Districts of Stratford-on-Avon and Brailes.
1885-1918: The existing parliamentary borough of Warwick, the municipal borough of Royal Leamington Spa, and the local government districts of Milverton and Lillington.[4]
Proposed
Further to the 2023 Periodic Review of Westminster constituencies, enacted by the Parliamentary Constituencies Order 2023, from the 2024 United Kingdom general election, the constituency will be composed of the following (as they existed on 1 December 2020):
- The District of Warwick wards of: Bishop’s Tachbrook; Leamington Brunswick; Leamington Clarendon; Leamington Lillington; Leamington Milverton; Leamington Willes; Radford Semele; Warwick All Saints and Woodloes; Warwick Aylesford; Warwick Myton & Heathcote; Warwick Saltisford; Whitnash.[5]
Minor changes to align boundaries with those of wards in the District of Warwick. Budbrooke transferred to Kenilworth and Southam in exchange for Radford Semele.
History
The constituency was created under the Redistribution of Seats Act 1885, partially replacing the earlier and ancient Warwick constituency which until that year had sent two MPs to Westminster.[6]
Political history
Represented solely by Members of Parliament from the Conservative Party for 87 years from 1910-97, the seat was for much of this time a safe seat; seeing frequent majorities of more than 10,000 votes, and the seat was uncontested at both the 1918 and 1922 general elections. The seat had not been expected to change hands at the 1997 general election: as such James Plaskitt's defeat of Dudley Smith was a Portillo moment, without the decapitation of a government frontbencher. Plaskitt increased his majority at the 2001 general election, but on a lower turnout. At the 2005 general election, Warwick and Leamington was 85th on the Conservative list of target seats, meaning that to gain it they would have required a somewhat greater swing than was seen nationally. With a greater swing from Labour to the Liberal Democrats, Plaskitt narrowly retained the seat with a majority slashed from nearly 6,000 votes to a mere 266.
However, minor boundary changes in Labour's favour took effect at the 2010 general election and the winner was variously predicted.[citation needed] In 2010, the seat was gained by a Conservative, Chris White, with a majority of 7% of the vote. On this occasion, the Conservative Party was the main beneficiary from swings away from the Labour Party and the Green Party. White held the seat in 2015 with an increased majority of 6,606 votes. The Labour candidate, Matthew Western gained the seat from the Conservatives on a swing of 7.6% at the 2017 snap general election, overturning a majority of 6,606 votes.[7] (this was the fourth-largest lead overturned by Labour at the 2017 general election). This made Matt Western the second MP for Warwick and Leamington from the Labour Party in the history of the constituency. At the 2019 general election, Western held the seat with a slightly reduced majority.
Prominent members
From 1923-57, the seat was represented by Sir Anthony Eden, who served as Prime Minister of the United Kingdom from 1955-57.
For part of the early-1920s, the Solicitor General for England and Wales, then Attorney General for England and Wales, represented the seat, Sir Ernest Pollock. Eden's successor, Sir John Hobson, was also in all of those senior positions for part of the early-1960s.
Elections
Elections in the 2020s
Elections in the 2010s
General election 2019: Warwick and Leamington[13] | Party | Candidate | Votes | % | ±% |
| | Labour | Matt Western | 23,718 | 43.8 | −2.9 |
| | Conservative | Jack Rankin | 22,929 | 42.3 | −2.1 |
| | Liberal Democrats | Louis Adam | 4,995 | 9.2 | +4.0 |
| | Green | Jonathan Chilvers | 1,536 | 2.8 | +0.6 |
| | Brexit Party | Tim Griffiths | 807 | 1.5 | New |
| | Independent | Bob Dhillon | 153 | 0.3 | New |
| | SDP | Xander Bennett | 67 | 0.1 | New |
| Majority | 789 | 1.5 | −0.8 |
| Turnout | 54,205 | 71.0 | −1.8 |
| | Labour hold | Swing | −0.4 | |
General election 2017: Warwick and Leamington[14] | Party | Candidate | Votes | % | ±% |
| | Labour | Matt Western | 25,227 | 46.7 | +11.8 |
| | Conservative | Chris White | 24,021 | 44.4 | −3.5 |
| | Liberal Democrats | Nick Solman | 2,810 | 5.2 | +0.2 |
| | Green | Jonathan Chilvers | 1,198 | 2.2 | −1.7 |
| | UKIP | Bob Dhillon | 799 | 1.5 | −6.8 |
| Majority | 1,206 | 2.3 | N/A |
| Turnout | 54,160 | 72.8 | +2.1 |
| | Labour gain from Conservative | Swing | +7.6 | |
General election 2015: Warwick and Leamington[15][16] | Party | Candidate | Votes | % | ±% |
| | Conservative | Chris White | 24,249 | 47.9 | +5.3 |
| | Labour | Lynnette Kelly | 17,643 | 34.9 | −0.5 |
| | UKIP | Alastair MacBrayne | 4,183 | 8.3 | +6.4 |
| | Liberal Democrats | Haseeb Arif | 2,512 | 5.0 | −13.3 |
| | Green | Azzees Minott | 1,994 | 3.9 | +2.5 |
| Majority | 6,606 | 13.0 | +5.8 |
| Turnout | 50,770 | 70.7 | −0.3 |
| | Conservative hold | Swing | +2.5 | |
General election 2010: Warwick and Leamington[17][18][19] | Party | Candidate | Votes | % | ±% |
| | Conservative | Chris White | 20,876 | 42.6 | +8.2 |
| | Labour | James Plaskitt | 17,363 | 35.4 | −9.3 |
| | Liberal Democrats | Alan Beddow | 8,977 | 18.3 | +2.4 |
| | UKIP | Christopher Lenton | 926 | 1.9 | +0.2 |
| | Green | Ian Davison | 693 | 1.4 | −1.9 |
| | Independent | Jim Cullinane | 197 | 0.4 | New |
| Majority | 3,513 | 7.2 | N/A |
| Turnout | 49,032 | 71.0 | +5.3 |
| | Conservative gain from Labour | Swing | +8.75 | |
Elections in the 2000s
General election 2005: Warwick and Leamington[20][21][22] | Party | Candidate | Votes | % | ±% |
| | Labour | James Plaskitt | 22,238 | 40.6 | -8.2 |
| | Conservative | Chris White | 21,972 | 40.1 | +2.5 |
| | Liberal Democrats | Linda Forbes | 8,119 | 14.8 | +3.7 |
| | Green | Ian Davison | 1,534 | 2.8 | New |
| | UKIP | Greville Warwick | 921 | 1.7 | +0.5 |
| Majority | 266 | 0.5 | -10.7 |
| Turnout | 54,744 | 67.4 | +1.6 |
| | Labour hold | Swing | -5.4 | |
Elections in the 1990s
General election 1997: Warwick and Leamington[23][22][24] | Party | Candidate | Votes | % | ±% |
| | Labour | James Plaskitt | 26,747 | 44.5 | +11.5 |
| | Conservative | Dudley Smith | 23,349 | 38.9 | -9.5 |
| | Liberal Democrats | Nigel Hicks | 7,133 | 11.9 | -4.7 |
| | Referendum | Val Davis | 1,484 | 2.5 | New |
| | Green | Paul Baptie | 764 | 1.3 | -0.1 |
| | Independent | Greville Warwick | 306 | 0.5 | New |
| | Independent | Michael Gibbs | 183 | 0.3 | New |
| | Natural Law | Roddy McCarthy | 125 | 0.2 | -0.1 |
| Majority | 3,398 | 5.6 | N/A |
| Turnout | 60,091 | 75.1 | -6.5 |
| | Labour gain from Conservative | Swing | +10.5 | |
General election 1992: Warwick and Leamington[22][25][26] | Party | Candidate | Votes | % | ±% |
| | Conservative | Dudley Smith | 28,093 | 48.4 | -1.4 |
| | Labour | Matthew Taylor | 19,158 | 33.0 | +9.5 |
| | Liberal Democrats | S. E. Boad | 9,645 | 16.6 | -7.9 |
| | Green | Janet Alty | 803 | 1.4 | -0.8 |
| | Independent | R. Newby | 251 | 0.4 | New |
| | Natural Law | J. Brewster | 156 | 0.3 | New |
| Majority | 8,935 | 15.4 | -9.9 |
| Turnout | 58,106 | 81.6 | -5.6 |
| | Conservative hold | Swing | -5.5 | |
Elections in the 1980s
General election 1987: Warwick and Leamington[27][25] | Party | Candidate | Votes | % | ±% |
| | Conservative | Dudley Smith | 27,530 | 49.8 | -1.1 |
| | Alliance | Kevin O'Sullivan | 13,548 | 24.5 | -1.4 |
| | Labour | Ann Christina | 13,019 | 23.5 | +1.5 |
| | Green | Janet Alty | 1,214 | 2.2 | +0.9 |
| Majority | 13,982 | 25.3 | +0.3 |
| Turnout | 55,311 | 76.0 | +2.4 |
| | Conservative hold | Swing | -1.3 | |
General election 1983: Warwick and Leamington[28][25] | Party | Candidate | Votes | % | ±% |
| | Conservative | Dudley Smith | 26,512 | 50.9 | -3.5 |
| | Alliance | Robert Behrens | 13,480 | 25.9 | +10.9 |
| | Labour | Richard Chessum | 11,463 | 22.0 | -7.3 |
| | Ecology | Nicholas Charlton | 685 | 1.3 | -0.1 |
| Majority | 13,032 | 25.0 | -0.1 |
| Turnout | 52,140 | 73.6 | -4.1 |
| | Conservative hold | Swing | -7.2 | |
Elections in the 1970s
General election 1979: Warwick and Leamington | Party | Candidate | Votes | % | ±% |
| | Conservative | Dudley Smith | 35,925 | 54.4 | +7.3 |
| | Labour | C. J. Gray | 19,367 | 29.3 | -3.8 |
| | Liberal | D. Woodcock | 9,905 | 15.0 | -4.8 |
| | Ecology | P. Sizer | 905 | 1.4 | New |
| Majority | 16,558 | 25.1 | +11.1 |
| Turnout | 66,102 | 77.7 | +2.9 |
| | Conservative hold | Swing | +5.6 | |
General election October 1974: Warwick and Leamington | Party | Candidate | Votes | % | ±% |
| | Conservative | Dudley Smith | 27,721 | 47.1 | -0.4 |
| | Labour | J. W. England | 19,476 | 33.1 | +3.4 |
| | Liberal | Timothy A. Jones | 11,625 | 19.8 | -3.0 |
| Majority | 8,245 | 14.0 | -3.8 |
| Turnout | 58,822 | 74.8 | -6.8 |
| | Conservative hold | Swing | -1.9 | |
General election February 1974: Warwick and Leamington | Party | Candidate | Votes | % | ±% |
| | Conservative | Dudley Smith | 30,167 | 47.5 | -15.9 |
| | Labour | J. W. England | 18,874 | 29.7 | -6.9 |
| | Liberal | Timothy A. Jones | 14,500 | 22.8 | New |
| Majority | 11,293 | 17.8 | -9.0 |
| Turnout | 63,541 | 81.6 | +9.0 |
| | Conservative hold | Swing | -19.4 | |
Elections in the 1960s
General election 1966: Warwick and Leamington | Party | Candidate | Votes | % | ±% |
| | Conservative | John Hobson | 28,918 | 51.6 | -2.2 |
| | Labour | Les Huckfield | 20,221 | 36.1 | +2.0 |
| | Liberal | Antony Butcher | 6,912 | 12.3 | +0.2 |
| Majority | 8,697 | 15.5 | -4.2 |
| Turnout | 56,051 | 78.9 | -1.5 |
| | Conservative hold | Swing | -2.1 | |
General election 1964: Warwick and Leamington | Party | Candidate | Votes | % | ±% |
| | Conservative | John Hobson | 29,749 | 53.8 | -8.8 |
| | Labour | Nigel Spearing | 18,865 | 34.1 | -3.3 |
| | Liberal | Peter Gibson | 6,676 | 12.1 | New |
| Majority | 10,884 | 19.7 | -5.5 |
| Turnout | 55,290 | 80.4 | -2.3 |
| | Conservative hold | Swing | -10.5 | |
Elections in the 1950s
General election 1959: Warwick and Leamington | Party | Candidate | Votes | % | ±% |
| | Conservative | John Hobson | 32,513 | 62.59 | -1.89 |
| | Labour | William Wilson | 19,434 | 37.41 | +1.89 |
| Majority | 13,079 | 25.18 | -3.78 |
| Turnout | 51,947 | 82.7 | |
| | Conservative hold | Swing | | |
General election 1955: Warwick and Leamington | Party | Candidate | Votes | % | ±% |
| | Conservative | Anthony Eden | 29,979 | 64.48 | 4.0 |
| | Labour | William Wilson | 16,513 | 35.52 | -4.0 |
| Majority | 13,466 | 28.96 | |
| Turnout | 46,492 | 78.77 | |
| | Conservative hold | Swing | +4.0 | |
General election 1951: Warwick and Leamington | Party | Candidate | Votes | % | ±% |
| | Conservative | Anthony Eden | 28,282 | 60.48 | 0.7 |
| | Labour | William Wilson | 18,479 | 39.52 | -0.7 |
| Majority | 9,803 | 20.96 | |
| Turnout | 46,761 | 82.38 | |
| | Conservative hold | Swing | +0.7 | |
General election 1950: Warwick and Leamington | Party | Candidate | Votes | % | ±% |
| | Conservative | Anthony Eden | 27,353 | 59.78 | -1.5 |
| | Labour | H. Bithell | 18,400 | 40.22 | +8.0 |
| Majority | 8,953 | 19.56 | |
| Turnout | 45,753 | 82.86 | |
| | Conservative hold | Swing | -4.8 | |
Election in the 1940s
General Election 1939–40: Another General Election was required to take place before the end of 1940. The political parties had been making preparations for an election to take place from 1939 and by the end of this year, the following candidates had been selected;
Elections in the 1930s
General election 1935: Warwick and Leamington [29] | Party | Candidate | Votes | % | ±% |
| | Conservative | Anthony Eden | 35,746 | 76.58 | -4.0 |
| | Labour | J. Perry | 10,930 | 23.42 | +4.0 |
| Majority | 24,816 | 53.16 | |
| Turnout | 46,676 | 65.66 | |
| | Conservative hold | Swing | −4.0 | |
Elections in the 1920s
General election 1924: Warwick and Leamington [30] | Party | Candidate | Votes | % | ±% |
| | Unionist | Anthony Eden | 19,575 | 60.2 | +8.4 |
| | Liberal | George Nicholls | 12,966 | 39.8 | +4.4 |
| Majority | 6,609 | 20.4 | +4.0 |
| Turnout | 32,541 | 73.6 | +0.7 |
| | Unionist hold | Swing | +2.0 | |
Elections in the 1910s
Elections in the 1900s
Elections in the 1890s
- Caused by Peel's elevation to the peerage, becoming Viscount Peel.
Elections in the 1880s
See also
Notes
References
- ^ "Electorate Figures – Boundary Commission for England". 2011 Electorate Figures. Boundary Commission for England. 4 March 2011. Archived from the original on 6 November 2010. Retrieved 13 March 2011.
- ^ Leigh Rayment's Historical List of MPs – Constituencies beginning with "W" (part 1)
- ^ Unemployment claimants by constituency The Guardian
- ^ "Chap. 23. Redistribution of Seats Act, 1885". The Public General Acts of the United Kingdom passed in the forty-eighth and forty-ninth years of the reign of Queen Victoria. London: Eyre and Spottiswoode. 1885. pp. 111–198.
- ^ "The Parliamentary Constituencies Order 2023". Schedule 1 Part 8 West Midlands region.
- ^ 2010 post-revision map non-metropolitan areas and unitary authorities of England
- ^ "Election results 2017: Labour takes Warwick and Leamington seat". bbc.co.uk. 9 June 2017. Retrieved 12 July 2017.
- ^ "Warwick reaction to the general election announcement". James Smith. Retrieved 23 May 2024.
- ^ "Liberal Democrat Prospective Parliamentary Candidates". Mark Pack. Retrieved 13 March 2024.
- ^ "Warwick and Leamington Constituency". Reform UK. Retrieved 13 March 2024.
- ^ "Conservatives select candidate to fight seat at next general election". Leamington Observer. Retrieved 13 March 2024.
- ^ "Greens announce parliamentary candidate for Warwick and Leamington ahead of general election". Warwick Nub News. Retrieved 13 March 2024.
- ^ "Warwick & Leamington Parliamentary constituency". BBC News. BBC. Retrieved 13 December 2019.
- ^ "General election 2017". Warwick District Council. Retrieved 9 June 2017.
- ^ "Elections 2015". Warwick District Council. Retrieved 9 June 2017.
- ^ "Election Data 2015". Electoral Calculus. Archived from the original on 17 October 2015. Retrieved 17 October 2015.
- ^ "Election Data 2010". Electoral Calculus. Archived from the original on 26 July 2013. Retrieved 17 October 2015.
- ^ "Warwick District Council, Official list of candidates" (PDF).
- ^ "UK > England > West Midlands > Warwick & Leamington". Election 2010. BBC. 7 May 2010. Retrieved 12 May 2010.
- ^ "Election Data 2005". Electoral Calculus. Archived from the original on 15 October 2011. Retrieved 18 October 2015.
- ^ "BBC NEWS-Election 2005-Results-Warwick & Leamington". news.bbc.co.uk.
- ^ a b c d "Politics". The Guardian.
- ^ a b "BBC NEWS-VOTE 2001-RESULTS & CONSTITUENCIES-Warwick & Leamington". news.bbc.co.uk.
- ^ a b "United Kingdom Parliamentary Election results 1997-: English Counties part 3". www.election.demon.co.uk.
- ^ a b c "British Parliamentary Election results 1983-97: English Counties". www.election.demon.co.uk.
- ^ "Politics Resources". Election 1992. Politics Resources. 9 April 1992. Retrieved 6 December 2010.
- ^ "Election Data 1987". Electoral Calculus. Archived from the original on 15 October 2011. Retrieved 18 October 2015.
- ^ "Election Data 1983". Electoral Calculus. Archived from the original on 15 October 2011. Retrieved 18 October 2015.
- ^ a b F W S Craig, British Parliamentary Election Results 1918–1949; Political Reference Publications, Glasgow 1949
- ^ a b c d British Parliamentary Election Results 1918-1949, FWS Craig
- ^ Craig, F. W. S. (1983). British parliamentary election results 1918–1949 (3 ed.). Chichester: Parliamentary Research Services. ISBN 0-900178-06-X.
- ^ a b c d e f g h i j Craig, FWS, ed. (1974). British Parliamentary Election Results: 1885-1918. London: Macmillan Press. ISBN 9781349022984.
- ^ "The New Parliament". The Morning Post. 25 November 1885. p. 5. Retrieved 14 December 2017 – via British Newspaper Archive.
External links
- Richard Kimber's Political Science Resources: UK General Elections since 1832
- 1968 By Election Results
- 1957 By Election Results
- Catalogue of the Warwick and Leamington Constituency Labour Party archives, held at the Modern Records Centre, University of Warwick
Constituencies in the West Midlands (59)
| Conservative (40) | - Aldridge-Brownhills
- Birmingham Northfield
- Bromsgrove
- Burton
- Cannock Chase
- Dudley North
- Dudley South
- Halesowen and Rowley Regis
- Hereford and South Herefordshire
- Kenilworth and Southam
- Lichfield
- Ludlow
- Meriden
- Mid Worcestershire
- Newcastle-under-Lyme
- North Herefordshire
- North Warwickshire
- Nuneaton
- Redditch
- Rugby
- Shrewsbury and Atcham
- South Staffordshire
- Stafford
- Staffordshire Moorlands
- Stoke-on-Trent Central
- Stoke-on-Trent North
- Stoke-on-Trent South
- Stone
- Stourbridge
- Stratford-on-Avon
- Sutton Coldfield
- The Wrekin
- Walsall North
- West Bromwich East
- West Bromwich West
- West Worcestershire
- Wolverhampton North East
- Wolverhampton South West
- Worcester
- Wyre Forest
|
|---|
| Labour (16) | - Birmingham Edgbaston
- Birmingham Erdington
- Birmingham Hall Green
- Birmingham Hodge Hill
- Birmingham Ladywood
- Birmingham Perry Barr
- Birmingham Selly Oak
- Birmingham Yardley
- Coventry North East
- Coventry North West
- Coventry South
- Tamworth
- Walsall South
- Warley
- Warwick and Leamington
- Wolverhampton South East
|
|---|
| Liberal Democrats (1) | |
|---|
| Independent (2) | |
|---|
- East Midlands
- East of England
- London
- North East England
- North West England
- Northern Ireland
- Scotland
- South East England
- South West England
- Wales
- West Midlands
- Yorkshire and the Humber
|
|
|---|
|
| Suburbs | |
|---|
Notable buildings
and structures | |
|---|
| School and colleges | |
|---|
Parks and
geographical features | |
|---|
| Sports clubs and organisations | |
|---|
Authority control databases: People  | |
|---|
52°18′N 1°36′W / 52.30°N 1.60°W / 52.30; -1.60


