U.S. House district for Nevada
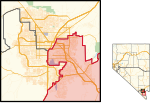
Nevada's 1st congressional district Interactive map of district boundaries since January 3, 2023
Representative Distribution Population (2022) 767,891 Median household $63,781[1] Ethnicity 39.6% White 36.0% Hispanic 10.0% Black 7.6% Asian 5.0% Two or more races 1.7% other Cook PVI D+3[2]
Nevada's 1st congressional district occupies parts of communities in Clark County east of the Las Vegas Freeway and south of Nellis Air Force Base , including parts of Las Vegas, most of Henderson, Paradise, Sunrise Manor, and Winchester, as well as all of Boulder City, Nelson, and Whitney. With a Cook Partisan Voting Index rating of D+3, it is the equal most Democratic districts in Nevada, along with the state’s 4th congressional district.[2]
Before the 1980 census , Nevada was represented by a single at-large congressional district . As a result of the redistricting cycle after the 1980 census , Nevada was split into two districts, due to its high population growth, relative to the rest of the country. From 1983 to 1993, the 1st district included most of Clark County. From 1993 to 2003, it covered most of the Las Vegas Valley , while the surrounding parts of Clark County (and the rest of the state) were in the 2nd district . Following the 2000 census , further population growth resulted in the creation of the 3rd congressional district , which included most of Henderson, North Las Vegas, Summerlin, and much of unincorporated Clark County. At the same time, the 1st district became smaller (and more population-dense ), more urban , and more Democratic-leaning. It contracted even further after the 2010 census , which made it a majority-minority district; Hispanics now make up a plurality of its voters.
Recent statewide election results Election results from presidential and statewide races.
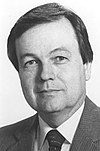
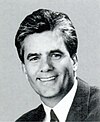
Results under current lines (since 2023) Results under old lines (2013-2023) Results under old lines (2003-2013) [3] Cities and townships List of members representing the district Member(Residency) Party Years Cong Electoral history District location District established January 3, 1983 Harry Reid (Las Vegas ) Democratic January 3, 1983 – 98th 99th Elected in 1982 .Re-elected in 1984 .run for U.S. senator . 1983–1993 Clark James Bilbray (Las Vegas ) Democratic January 3, 1987 – 100th 101st 102nd 103rd Elected in 1986 .Re-elected in 1988 .Re-elected in 1990 .Re-elected in 1992 . 1993–2003 Clark John Ensign (Las Vegas ) Republican January 3, 1995 – 104th 105th Elected in 1994 .Re-elected in 1996 .run for U.S. senator . Shelley Berkley (Las Vegas ) Democratic January 3, 1999 – 106th 107th 108th 109th 110th 111th 112th Elected in 1998 .Re-elected in 2000 .Re-elected in 2002 .Re-elected in 2004 .Re-elected in 2006 .Re-elected in 2008 .Re-elected in 2010 .run for U.S. senator . 2003–2013 Clark Dina Titus (Las Vegas ) Democratic January 3, 2013 – 113th 114th 115th 116th 117th 118th Elected in 2012 .Re-elected in 2014 .Re-elected in 2016 .Re-elected in 2018 .Re-elected in 2020 .Re-elected in 2022 . 2013–2023 Clark 2023–present Clark
Election results 1982 1982 election [4] Party Candidate Votes % Democratic Harry Reid 61,901 57.54 Republican Peggy Cavnar 45,675 42.46 Total votes 107,576 100.0 Democratic win (new seat)
1984 1984 election [5] Party Candidate Votes % Democratic Harry Reid (Incumbent) 73,242 56.12 Republican Peggy Cavnar 55,391 42.44 Libertarian Joe Morris 1,885 1.44 Total votes 130,518 100.0 Democratic hold
1986 1986 election [6] Party Candidate Votes % Democratic James Bilbray 61,830 54.09 Republican Bob Ryan 59,433 44.04 Libertarian Gordon Michael Morris 2,145 1.88 Total votes 114,317 100.0 Democratic hold
1988 1988 election [7] Party Candidate Votes % Democratic James Bilbray (Incumbent) 101,764 63.97 Republican Lucille Lusk 53,588 33.69 Libertarian Patrick O'Neill 3,724 2.34 Total votes 159,076 100.0 Democratic hold
1990 1990 election [8] Party Candidate Votes % Democratic James Bilbray (Incumbent) 84,650 61.41 Republican Bob Dickinson 47,377 34.37 Libertarian William Moore 5,825 4.23 Total votes 137,852 100.0 Democratic hold
1992 1992 election [9] Party Candidate Votes % Democratic James Bilbray (Incumbent) 128,178 57.87 Republican J. Coy Pettyjohn 84,217 38.02 Libertarian Scott A. Kjar 8,993 4.06 Total votes 221,488 100.0 Democratic hold
1994 1994 election [10] Party Candidate Votes % Republican John Ensign 73,769 48.48 Democratic James Bilbray (Incumbent) 72,333 47.54 Libertarian Gary Wood 6,065 3.99 Total votes 152,167 100.0 Republican gain from Democratic
1996 1998 2000 2002 2004 2006 2008 2010 2010 election [18] Party Candidate Votes % Democratic Shelley Berkley (Incumbent) 103,246 61.75 Republican Kenneth Wegner 58,995 35.28 Independent American Jonathan J. Hansen 2,847 1.70 Libertarian Ed Klapproth 2,118 1.27 Total votes 167,306 100.0 Democratic hold
2012 2012 election [19] Party Candidate Votes % Democratic Dina Titus 113,967 63.57 Republican Chris Edwards 56,521 31.53 Independent American Stan Vaughan 4,145 2.31 Libertarian William "Bill" Pojunis 4,645 2.59 Total votes 179,278 100.0 Democratic hold
2014 Nevada's 1st Congressional District, 2014[20] Party Candidate Votes % Democratic Dina Titus (Incumbent) 45,643 56.84 Republican Annette Teijeiro 30,413 37.87 Libertarian Richard Charles 2,617 3.26 Independent American Kamau Bakari 1,626 2.03 Total votes 80,299 100 Democratic hold
2016 Nevada's 1st Congressional District, 2016[21] Party Candidate Votes % Democratic Dina Titus (Incumbent) 116,537 61.87 Republican Mary Perry 54,174 28.76 Independent Reuben D'Silva 13,897 7.38 Independent American Kamau Bakari 3,744 1.99 Total votes 188,352 100.00 Democratic hold
2018 Nevada's 1st Congressional District, 2018[22] Party Candidate Votes % ±% Democratic Dina Titus (Incumbent) 100,674 66.16 +4.29% Republican Joyce Bentley 46,969 30.87 +2.11% Independent American Dan Garfield 2,453 1.61 -0.38% Libertarian Robert Van Strawder Jr. 2,061 1.36 N/A Margin of victory 53,705 35.29 +2.18% Total votes 152,157 100.0 N/A Democratic hold
2020 Nevada's 1st congressional district, 2020[23] Party Candidate Votes % Democratic Dina Titus (incumbent) 137,868 61.8 Republican Joyce Bentley 74,490 33.4 Independent American Kamau Bakari 6,190 2.8 Libertarian Robert Van Strawder 4,665 2.1 Total votes 223,213 100.0 Democratic hold
2022 Nevada's 1st congressional district, 2022[24] Party Candidate Votes % Democratic Dina Titus (incumbent) 115,700 51.6 Republican Mark Robertson 103,115 46.0 Libertarian Ken Cavanaugh 5,534 2.5 Total votes 224,349 100.0 Democratic hold
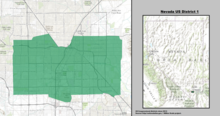
Historical district boundaries 2003–2013
2013–2023
See also United States portal
References Martis, Kenneth C. (1989). The Historical Atlas of Political Parties in the United States Congress . New York: Macmillan Publishing Company. Congressional Biographical Directory of the United States 1774–present ^ "My Congressional District". ^ a b "2022 Cook PVI: District Map and List". Cook Political Report . Retrieved January 10, 2023 . ^ Presidential Election Results, by district, swingstateproject.com ^ "1982 Election Results" (PDF) . Retrieved November 7, 2018 . ^ "1984 Election Results" (PDF) . Retrieved November 7, 2018 . ^ "1986 Election Results" (PDF) . Retrieved November 7, 2018 . ^ "1988 Election Results" (PDF) . Retrieved November 7, 2018 . ^ "1990 Election Results" (PDF) . Retrieved November 7, 2018 . ^ 1992 Election Results ^ "1994 Election Results" (PDF) . Retrieved November 7, 2018 . ^ 1996 Election Results ^ "1998 Election Results" (PDF) . Retrieved November 7, 2018 . ^ "2000 Election Results" (PDF) . Retrieved November 7, 2018 . ^ "2002 Election Results" (PDF) . Retrieved November 7, 2018 . ^ "2004 Election Results" (PDF) . Retrieved November 7, 2018 . ^ "2006 Election Results" (PDF) . Retrieved November 7, 2018 . ^ "2008 Election Results" (PDF) . Retrieved November 7, 2018 . ^ "Congressional results". www.nvsos.gov . Retrieved November 7, 2018 . ^ 2012 Election Results ^ "Silver State Election Night Results 2014". Nevada Secretary of State. November 4, 2014. Retrieved December 23, 2014 . ^ "Silver State Election Night Results 2016". Nevada Secretary of State. November 8, 2016. Retrieved December 9, 2016 . ^ "Silver State 2018 Election Night Results | U.S. House of Representatives". Nevada Secretary of State . November 14, 2018. ^ "Silver State 2020 Election Results - U.S. Congress". Nevada Secretary of State . Retrieved November 27, 2020 . ^ "Silver State 2022 - General Election Results - U.S. Congress". Nevada Secretary of State .
Authority control databases
36°08′01″N 115°09′05″W / 36.13361°N 115.15139°W / 36.13361; -115.15139


 United States portal


